

Weather Station, Intro
I was interested in monitoring conditions inside and outside my greenhouse, initially, with the idea of automating and optimising watering, turning on ventilation etc. This sort of advanced control hasn’t exactly happened yet but at least I’ve made progress with the measurement part! The idea is that the various instruments connect to a central monitoring and control computer. This turned out to be a combination of Raspberry Pi(s) and Arduino type microcontrollers, connections being by Wi-Fi and I2C. The Raspberry Pi can be monitored remotely by VNC and the microcontrollers over Wi-Fi / UDP.
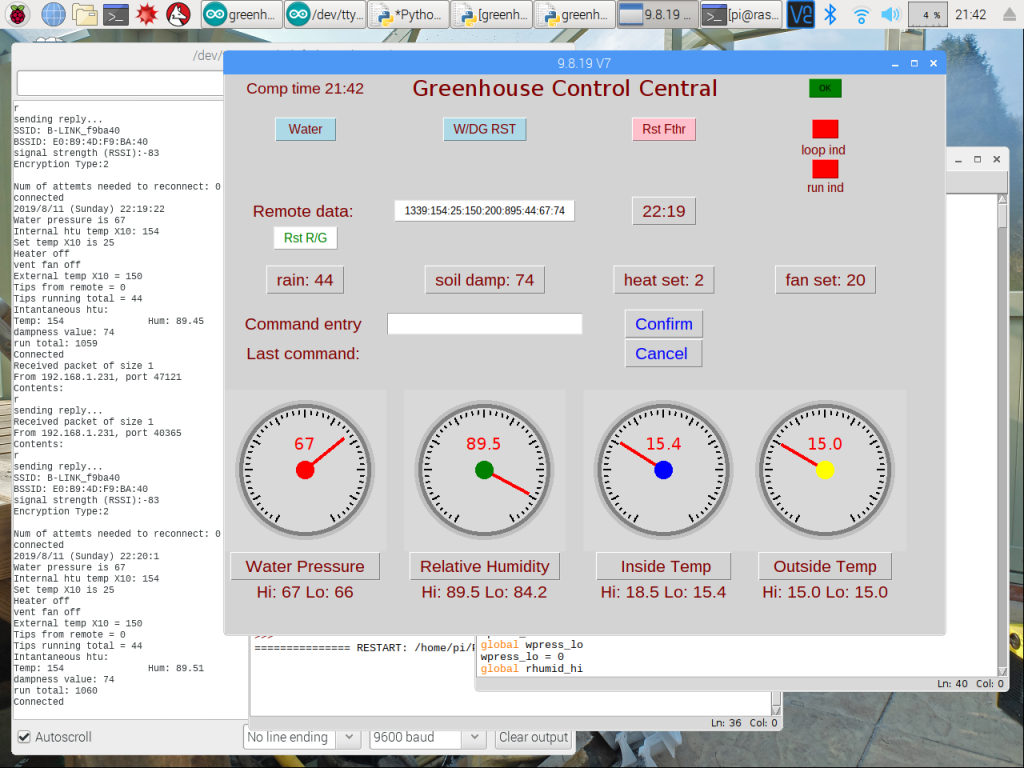
Below is a screen grab of the controlling Raspberry Pi at one stage of development. The graphical stuff is Python/TKinter and the scrolling text is the Arduino IDE serial monitor. I hope to include up to date software in due course. (Slightly out of date details can be found on my old site: www.mr-r.co.uk/)
The weather station incorporates a number of measuring instruments into which I have put enough construction work for me to justifiably claim (IMO) “I made that (them)”. Other measuring devices are pre-made and I have just put them in a box and connected them up! These include temperature, humidity and air pressure sensors. Those I have “made” include wind speed and direction, rainfall, solar radiation and soil moisture content. These are not necessarily very accurate but they give sufficient indication of conditions for my purposes and were fun to make!
Rain Gauge
This is based on the “tipping bucket” method. Two small open receptacles “buckets” are fitted at either end of a pivot like a see-saw. Rainwater is collected in a funnel and drips onto the bucket which is “up”. As it fills, it tips the see-saw (emptying in the process) and brings the second bucket under the funnel which fills, tips etc. and the process continues while the rain lasts. By counting the number of tips you can measure the volume of rain falling on the funnel and hence, by knowing the area of the funnel you can calculate the rainfall in inches, centimetres etc.
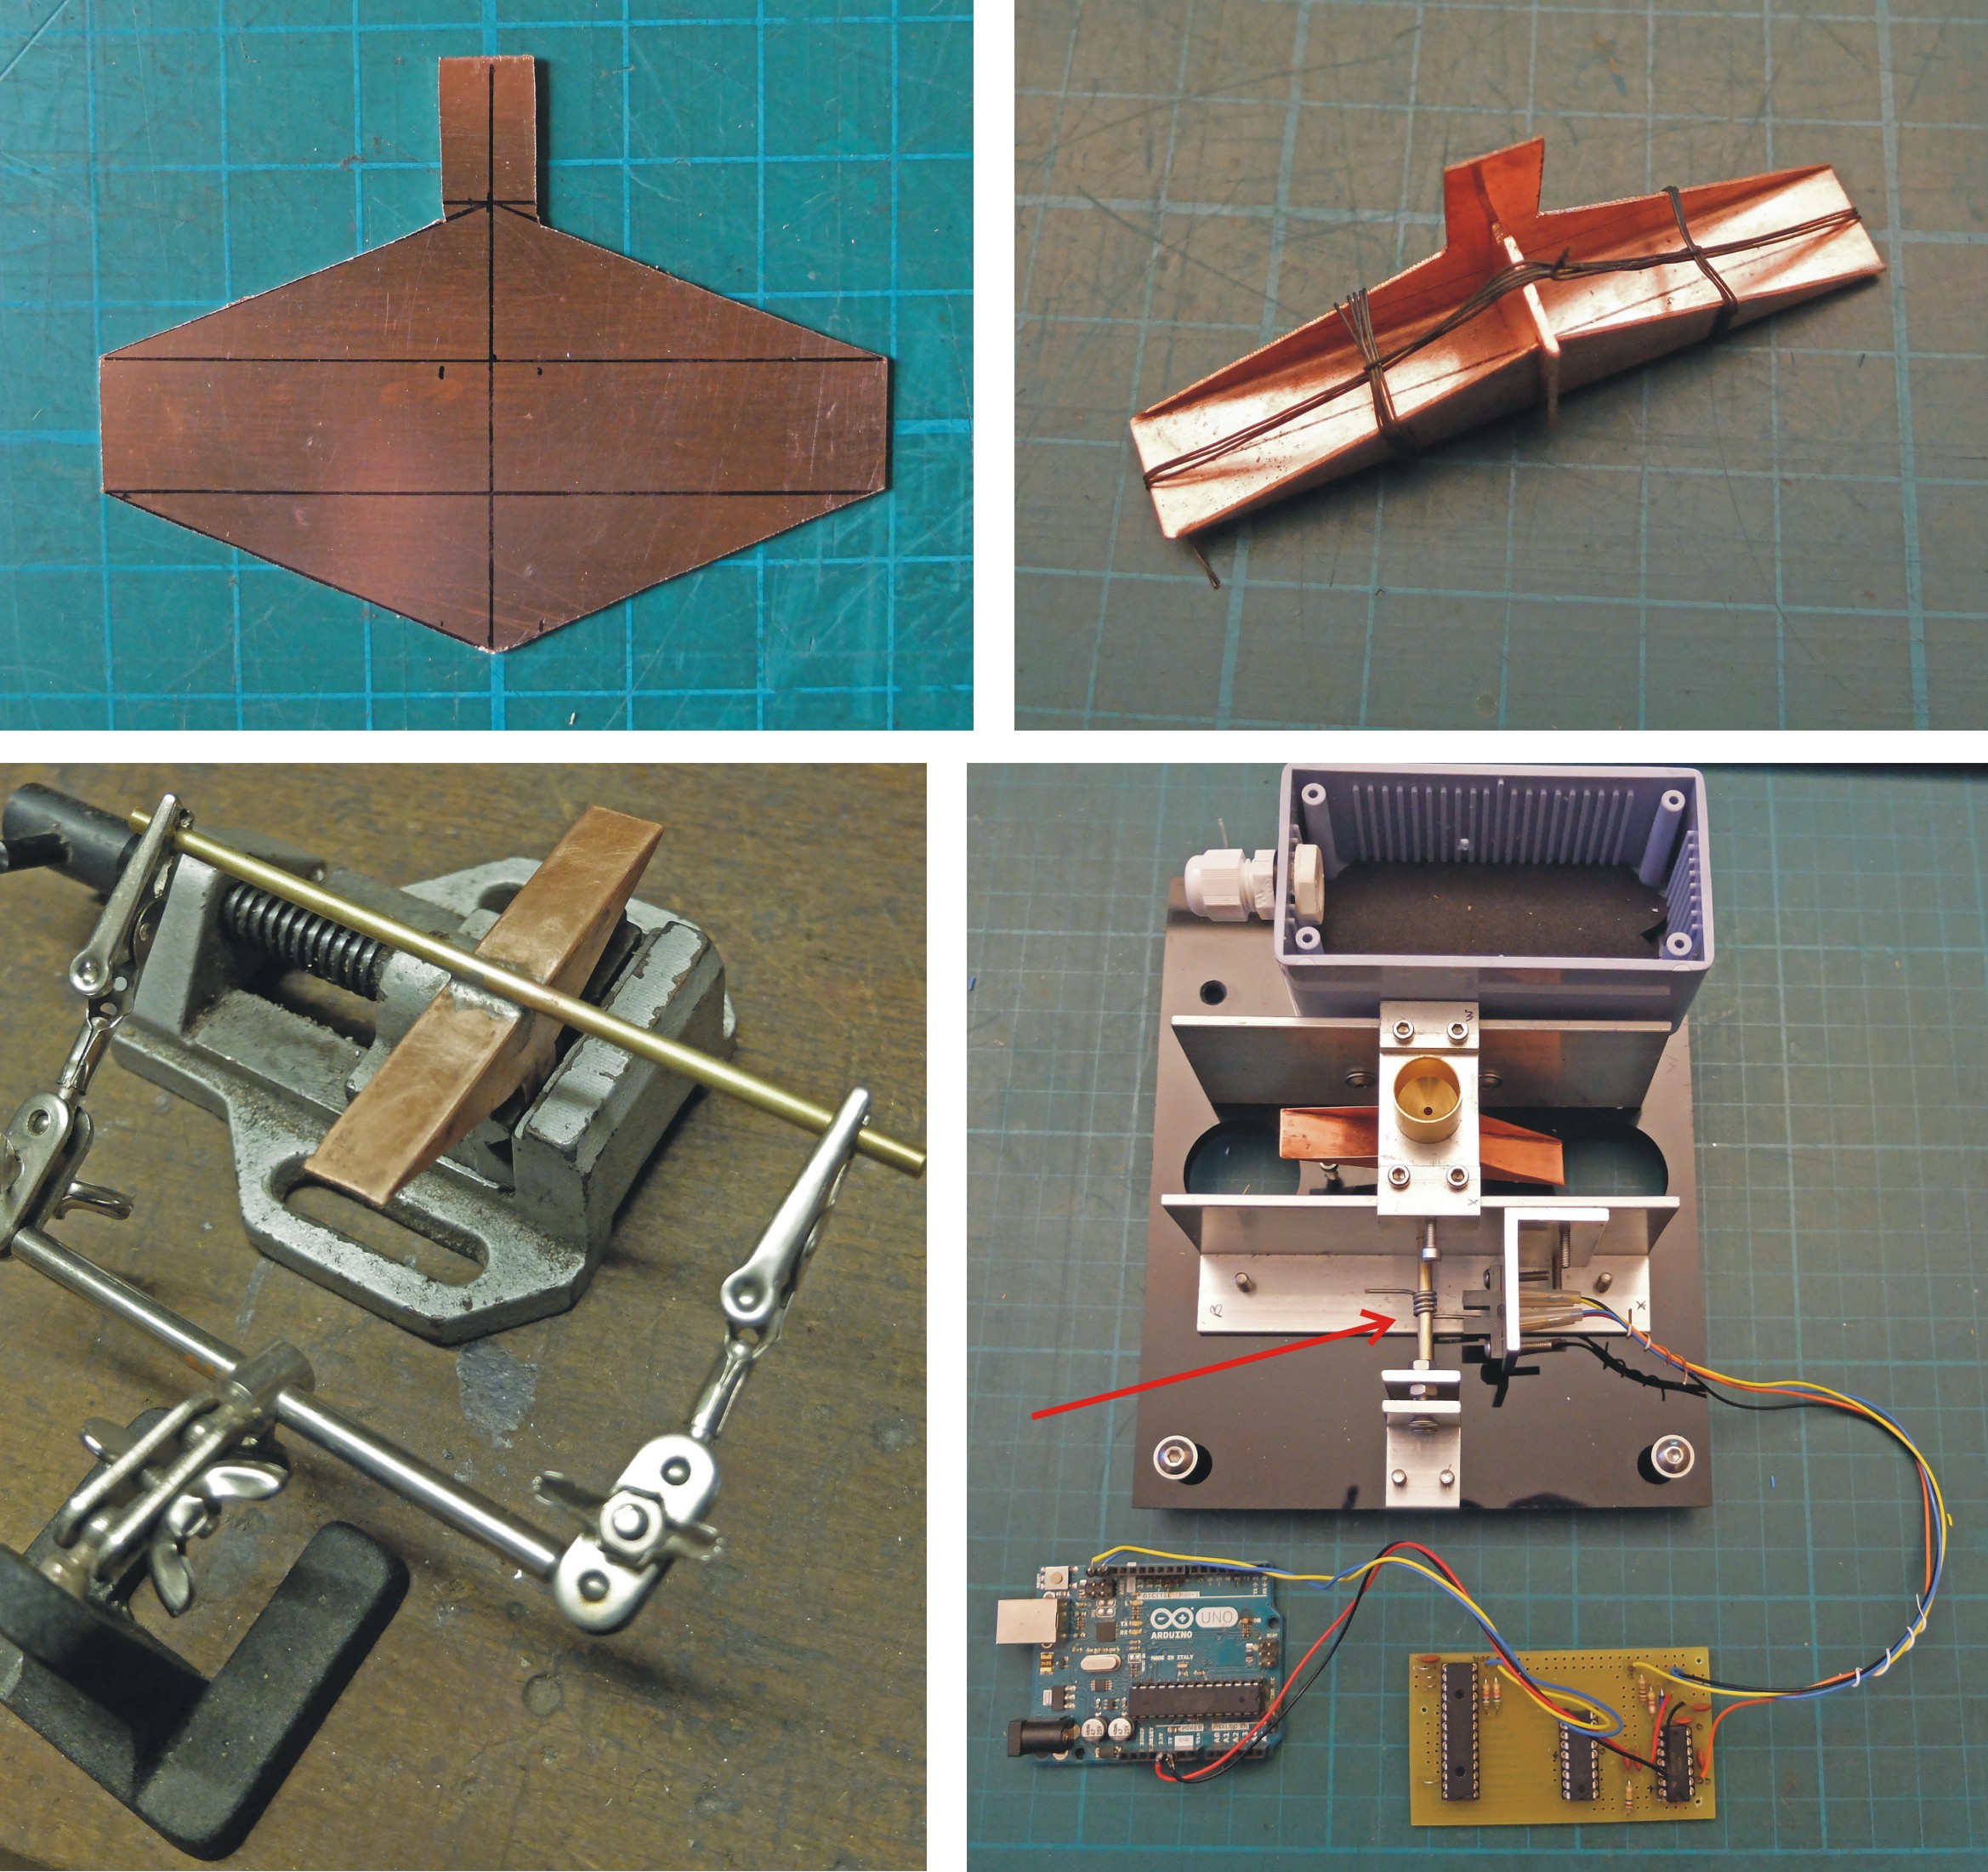
In the pictures above, top left, shows a piece of thin copper cut and ready to be bent into the shape of the two “buckets”. (Having had access to a commercially made tipping bucket rain gauge in the dim past, I made a guess at the sort of volume for the buckets which would work. (You can see the dimensions of the copper from the background grid the lines of which are 13mm apart. Later, I cut the “vane” off the top. I had intended that the vane would break the opto-switch beam but, to keep the electronics further away from the water, I replaced it with a wire on the pivot shaft – see below.)
Top right: the copper is bent into shape and a separate piece of copper inserted to form a division between the buckets. The iron wire keeps everything in place while the seams are silver-soldered.
Bottom left: a brass rod is soft-soldered on (with what used to be lead-tin) to act as a pivot.
Bottom right: the completed bucket swings between aluminium angle supports mounted on an acrylic base. The water goes in through the small hole in the brass fitting in the centre. For testing purposes, the circuitry is connected to an Arduino programmed to detect each time the wire (red arrow) breaks the beam in the opto-switch.
You can also see the water-tight (hopefully!) box in which the electronics will eventually live. The outer case for the unit will not allow water to directly reach the innards but, to let the water from the buckets as they tip to flow away, there will be holes in the bottom.
Electronics
The electronics count the number of tips by having the see-saw break the beam of an opto-switch. A microcontroller in the unit stores the number of tips which can be downloaded to a supervising computer over I2C.
Circuit diagram
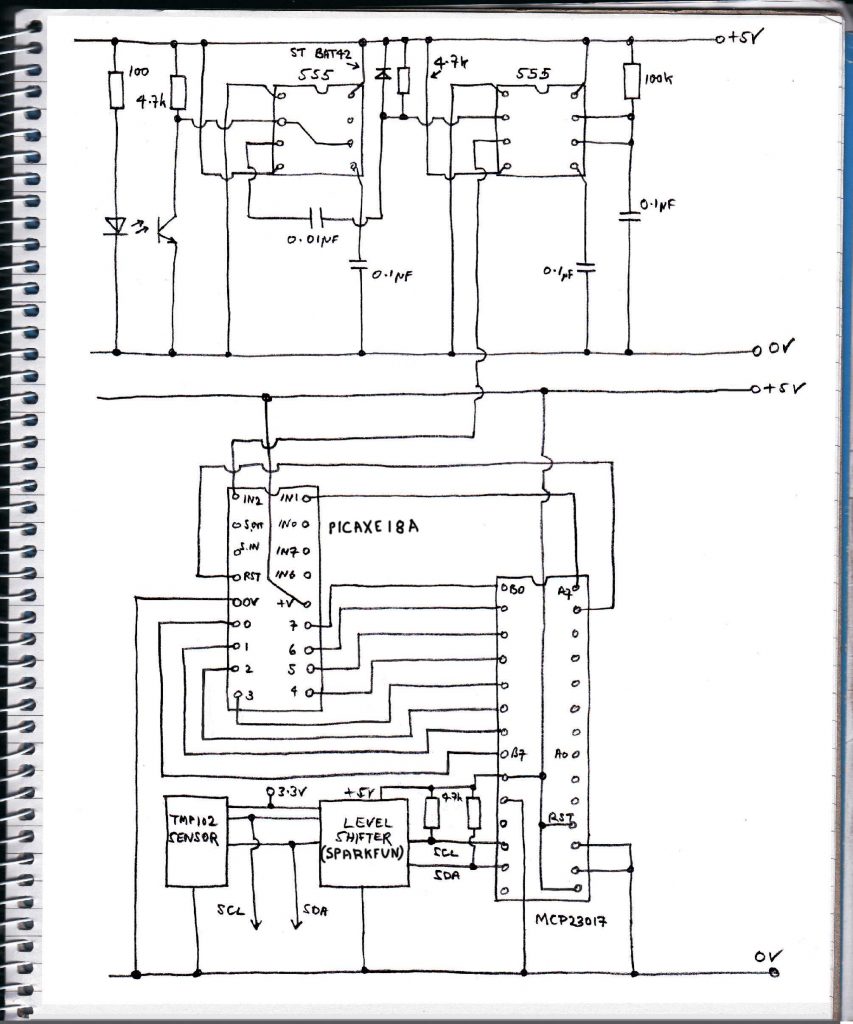
The circuit diagram is shown above. At the top, the photo-transistor, with its collector resistor, generates a positive pulse each time the beam is broken. This feeds into a 555 timer chip connected as a Schmitt Trigger. This produces an output that is either on (5v) or off (0v) and nothing in between. It also ensures that the output will not flutter as the beam is broken relatively slowly as far as electronic circuitry is concerned. (This because the circuit has hysteresis.)
The square wave output from the Scmitt passes through a differentiator circuit (the 0.01uF capacitir, the 4.7k resistor and the clamping diode. This produces brief negative going pulse which is used to trigger the second 555, this time set up as a one-shot pulse generator. This produces a short fixed length pulse which gives the Picaxe 18A microcontroller the best chance (I hope!) of counting the pulses accurately. (The Picaxe is a Microchip PIC16F819 microcontroller pre-programmed so that a serial connection from a PC or similar running a simple version of BASIC can easily get it do all sorts of (fairly simple) things with inputs and outputs and, in this case, count pulses.)
The current count appears on eight pins (which have been set to be outputs) in binary form. These pins are connected to a MCP2017 port expander chip whose pins can be written to and read over I2C. It’s quite possible to set up, say, an Arduino Uno to be an I2C slave and cut out the MCP2017 (and, of course, the Picaxe) but I find my way of doing this easier and more flexible.
The Picaxe operates at 5v so a Sparkfun level shifter converts the digital to 3.3v. I also included a TMP102 sensor to measure outside temperature.
I designed a PCB using Design Spark PCB (free software) and photo-etched a PCB for the project.
Monitoring the rain gauge output
The rain gauge output is monitored on my “Greenhouse Control” device described here. Now for the funnel and case.
Making the funnel & calibration
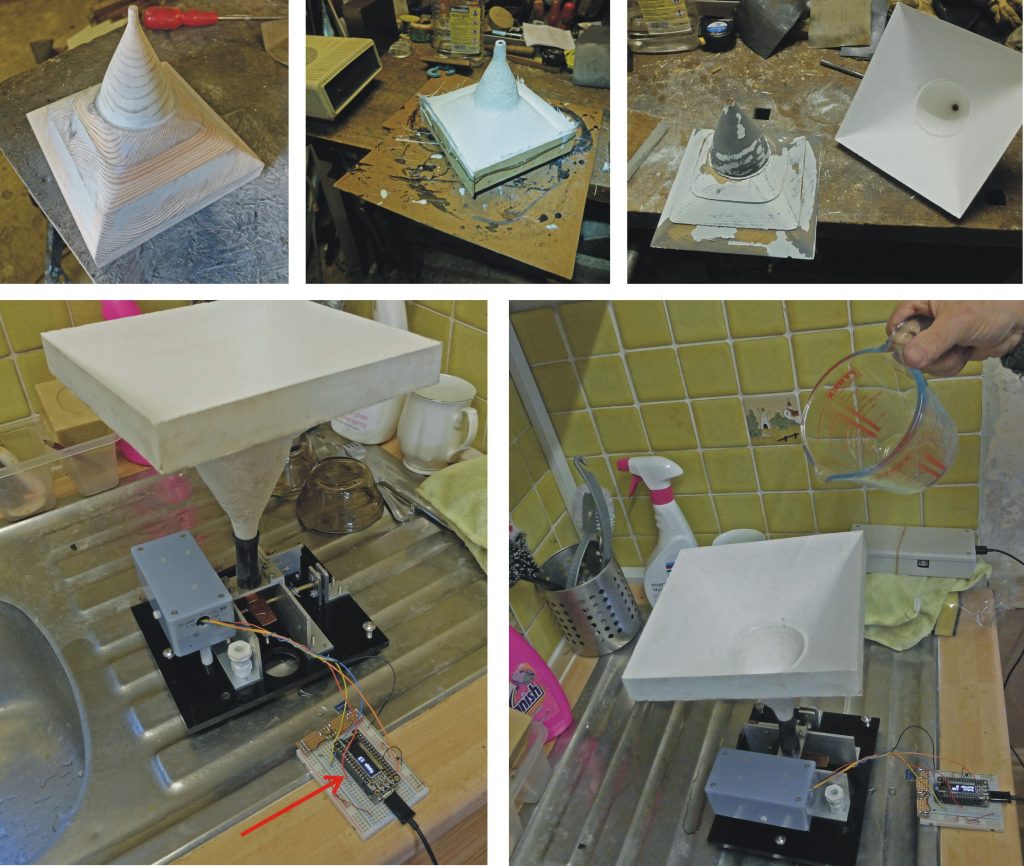
The funnel is made of GRP. It has a square shape as I reckoned it would be easier to make a flat-sided case than a cylindrical one. The pictures above (top row) show the process of making a wooded pattern, fibre-glassing over it and extracting the pattern to reveal the finished funnel.
The pictures at the bottom show the funnel and bucket unit (on the draining board) being calibrated. I connected the electronics to an Adafruit Feather with a nice little alpha-numeric display plugged in (red arrow). The feather was programmed to register the count. I poured in a known volume of water and made a note of the count. Knowing the area of the funnel top enables the water volume to be converted into the equivalent inches of liquid. Thus, “inches” = volume / area of funnel. So such and such “inches” results in the measured count and count / “inches” would give the count for one inch. In this case it was a count of 240 for one inch of rain.
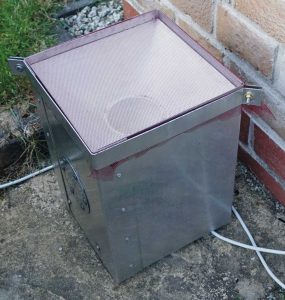
Making the case
One of the main things to consider in this project was to ensure that water doesn’t get into the electronics. As well as direct water entry through holes, joints and seams, you probably have to worry about condensation during cold periods and overheating when the sun shines. Polished aluminium cases reflect heat and silica-gel can keep down condensation (as long as the case is hermetically sealed). A bit of stray heat from electronics can also help to keep condensation at bay.
The case was made out of thin aluminium in four parts. I think it’s easier to make it this way rather than trying to make it in one if you haven’t got special sheet metal bending apparatus.
With this sort of kit, where there is no great strength required, scoring along the line of the bend with a craft knife results in a nice sharp bend. (Clamp the aluminium between two pieces of angle in a vice etc. and press the bend with a piece of ply or similar to keep the metal flat – except at the bend, of course.)
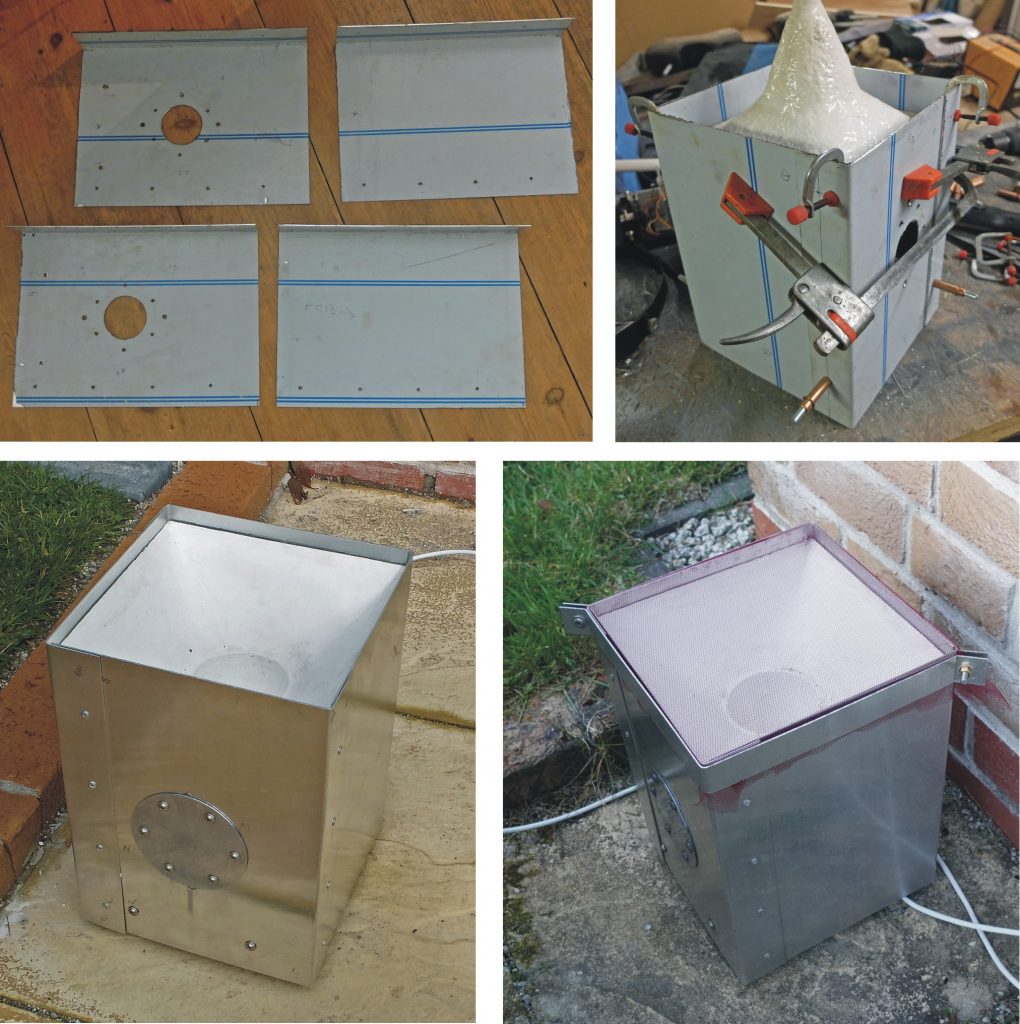
I used pop rivets to hold the bits together. The funnel was sealed into the case with silicon. As the case is lowered over the”works”, the outlet of the funnel slips into a piece of silicon rubber tubing.
The picture above, bottom right, shows a piece of fine nylon or similar (dressmaking) mesh clamped over the top to keep out the crud which would otherwise clog it in short order (as I found!)
More weather stations to follow!
Radiometer
Introduction
This project attempts to use a Crookes Radiometer novelty toy to make a sunlight detector to add to the elements of my weather station. The radiometer was invented by Sir William Crookes and consists of four vanes which can rotate in a partially evacuated glass bulb. The vanes are black on one side and white on the other. In sunlight they revolve, the speed of rotation increases as the intensity of the light increases so by measuring this speed, the electromagnetic energy of the light might be measured. I think this device is not directional and not affected by the position of the Sun which could be important in any measurement. (Although I am not anticipating any great accuracy here!). See here for further details including how it actually works.
I have included a small photo-voltaic cell to (perhaps) provide some sort of calibration to the radiometer (although this is directional).
The data from this unit is transmitted to a control unit (over I2C) which comprises an Adafruit Feather supervised by a Raspberry Pi. I can read the data remotely over VPN. This particular control unit also is plugged into my wind speed and direction indicator described elsewhere.
I am measuring the speed of the vanes by setting the radiometer up so that the vanes break a light beam. This is detected and the information is sent over I2C to a microprocessor in the base station (as is the voltage generated by the photo-voltaic). I also included an atmospheric pressure sensor and a temperature sensor which I had to hand to add to my weather station.
The circuit
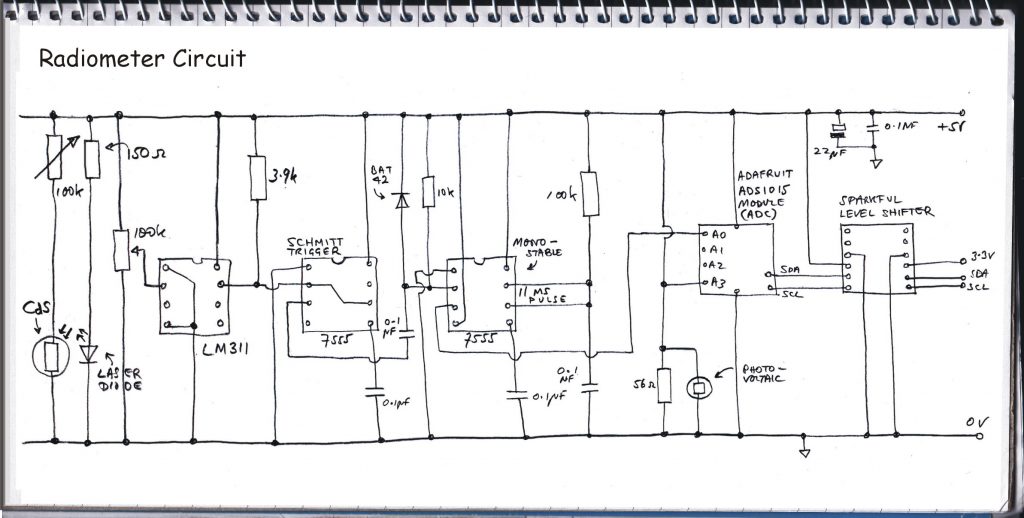
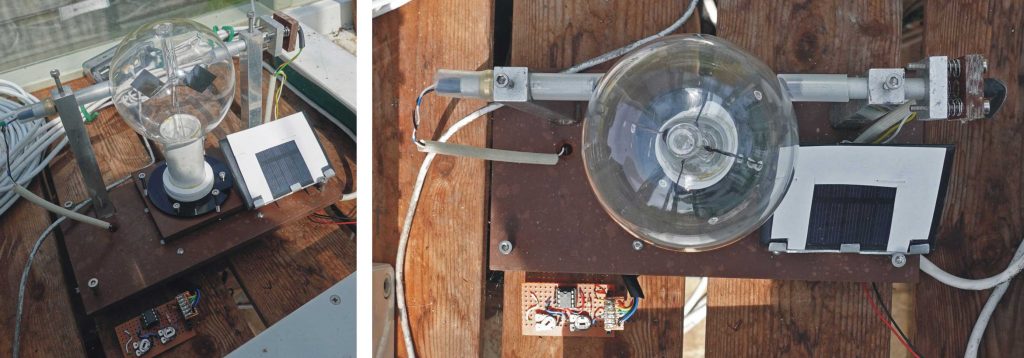
The circuit (see above) uses a cheap laser diode (99p on eBay) to shine a beam through the glass bulb of the radiometer. A light dependent resistor (LDR) detects the beam which is positioned to be interrupted as the vanes rotate. The diode and LDR are in tubes to avoid interference from daylight etc. as far as possible.
The LDR forms the bottom leg of a potential divider. As the LDR reduces in resistance as the light on it increases, the voltage on the divider is high until the rotating vane of the radiometer breaks the beam. In spite of the LDR being in a tube with the inside painted matt black, some daylight gets in and the change in resistance and hence the voltage change as the vanes break the beam, is not as great as it might be. I use an LM311 comparator IC to detect this relatively small change and convert it to a rapid swing on the output of the chip from 0v to 5v.
The output of the LM311 is fed into (my favourite chip!) a 555 timer configured as a Schmitt Trigger. This ensures the signal to the following circuits is either five volts or zero volts, nothing in between i.e. a square wave (within the speed that these circuits operate at, anyway!) This square wave then passes to a differentiator circuit (a small capacitor and a resistor and a clamping diode) which converts it into a brief negative going pulse which, in turn, triggers a 555 timer set up as a one-shot pulse generator. Thus every time the vane breaks the beam, the result (hopefully!) is a nice short, fixed length, square pulse.
The next part of the circuit counts the pulses and stores the result until the microprocessor in the remote control unit gets round to reading the current count (over I2C). Having done that, the microprocessor resets the counter and the process begins again. (There might be be a few lost pulses in this process but not enough to worry about in the context of the accuracy expected in this project.)
There are quite a few ways this could be achieved. However, I used a Picaxe (an easy to program microcontroller from Revolution Education) to count the pulses and measure the voltage from the photo-voltaic (it’s only 8-bit but that’s enough for my purposes). I am interfacing the Picaxe (type 20M2) with an MCP2017 port expander. I have used this over I2C on many occasions and have never had any trouble with it over 10m or more (I2C was not designed for such distances but it, mostly, works!)
The Picaxe has sixteen GPIO pins. I am connecting eight to one of the MCP2017’s ports to output the data collected by the Picaxe. Another three inter connections I am using to issue instructions to the Picaxe via the MCP2017 (output the count – low byte, high byte, output the pv voltage and, lastly, reset the counter) and another Picaxe pin gets pulses from the 555 and another, configured as an analogue to digital input, is connected to the pv.
The Picaxe is programmed to count up to 16-bits and can output the low byte and high byte in turn as mentioned above. The way I implemented the software, the Picaxe never has to store more than about 30 pulses, so unless we get a solar flare which burns the world to a crisp, I probably have enough storage in reserve!
I made a simple PCB for the circuit which I fitted under the base of the radiometer. I use a free design software (Design Spark) and use a simple photo-etch process. My PCBs are single-sided and so do mostly need a bit or wiring up to complete the circuit but this process is much better than using perforated strip board (Veroboard etc.) for anything other than the most basic circuit. The only expensive piece of kit needed is a UV light box. There is usually one on Ebay (where I got mine).
Nothing lasts forever!
I originally used a radiometer I had had for probably 30 or more years and the unit was made to suit its dimensions. Unexpectedly, after a few months it stopped working! Perhaps air leaked in? The problem was getting a replacement which matched the original. In the end I found a radiometer by Kikkerland (available on Amazon) which has no stem, it sort of plugs into a block of wood. So by discarding the block I was able to construct a support to get the vanes into the right place to interrupt the beam. There are cheaper radiometers available so if I were starting afresh, I would use one of those.
Construction
As regards the construction, I was aiming at a Victorian/Edwardian scientific instrument look here. Tufnol, which I have used for the base has a retro look (it is, after all, a relative of the first completely synthetic plastic, Bakelite) and also hints at mahogany. The supports for the laser diode and the photo diode sensor are made from ½” square aluminium bar drilled out to 8mm to take the aluminium tube (B&Q) which holds the diode and the LDR. The bases of the supports are drilled and tapped to M4 thread. I drilled corresponding holes in the Tufnol base. I then passed an 8mm tube through both holes to ensure they were correctly aligned put some epoxy under each support and tightened the screws securing the supports to the Tufnol base but not too tightly so that when the epoxy hardened, the supports would remain aligned.
The base is supported on four screws for levelling purposes. The laser diode can be aimed by adjusting three sprung-loaded screws. The support for the radiometer is also on three screws so that the vanes can be located correctly in the beam.
Program for Picaxe
'Program for PICAXE-20M2
'Counts 10ms pulses and measures 0-5 volts input to pinC.6 & pinC.7
'Outputs values on demand to portB
'Pins 0,1,2 control data on portB
'portB registers data, hi/lo byte counts & pv volts
'portC: 0,1,2 - hi/lo byte, reset count, get pv volts
'3,4,5 - not committed
'6 - 10ms pulse input
'7 - adc for pv volts

'Result of inputs to C.0,C.1,C.2 :-
'C.0  C.1   C.2   portB
'-------------------------------
'0    0     0     low byte count
'1    0     0     high byte count
'0    1     0     reset
'0    0     1     pv volts
'1    1     0     reset
'0    1     1     reset
'1    0     1     error
'1    1     1     reset
'-------------------------------
dirsC = %00110000
dirsB = 255
main:
 outpinsB = b0
 if pinC.1 = 1 then rst 	'reset counter
 if pinC.0 = 1 then hibyte    'set to read high byte
 if pinC.6 = 1 then add 	'pulse in pin
 if pinC.2 = 1 then pvvolts   'get pv volts

 goto main
'---------------------------------------------
add:
 if pinC.6 = 1 then add 	'wait for pulse to finish to avoid over counts
 w0 = w0 + 1
 goto main
'------------------------------------------------
hibyte:
 outpinsB = b1
 if pinC.0 = 1 then hibyte    'wait till high byte has been read
 goto main
'---------------------------------------------
rst:
 w0 = 0
 goto main
'----------------------------------------------
pvvolts:
 readadc C.7, b2
 outpinsB = b2
label:
 if pinC.2 = 1 then label     'wait for completion of pv reading
 goto main
'-----------------------------------------
The radiometer connects to the second of my control units which features an Adafruit Feather M0 connected to a Raspberry Pi by USB/Serial (unlike my first controller where the Feather and Pi communicate over Wi-Fi). The Feather processes the data from my radiometer (and also my wind speed and direction device and controls the servos on my Raspberry Pi pan and tilt camera) and the Pi displays the data using a Python/Tkinter programme. This can be monitored remotely over Wi-Fi using VPN. Details of all this to come (or you could look on my old website, www.mr-r.co.uk).
Wind speed & direction
Wind direction
This uses a separate wind direction weather vane and an anemometer using rotating cups.
To register the vane’s direction, I used a rotary encoder. Here, it would have been easier to use a commercially available type but it’s not too difficult to make one. Again, it would have been easier to have made one in the form of a disc (see illustration) but I chose to make one in the form of a cylinder (for some reason I can’t remember!)
How precise will the indication of the direction be is determined (amongst other things) by the number of bits in the output of the encoder. I want to distinguish sixteen different directions (N, NNE, NE, ENE etc.) and so I will need to generate a four bit number.
Rotary encoders are often devices with optical sensors. A light shines through a disc and is detected by a photo-transistor on the other side of the disc. Parts of the disc are clear and parts are obscure and so the transistor turns on and off as the disc rotates. A four bit encoder will have four photo-transistors and four tracks on the disc. You would think that the clear and obscure parts of the tracks on the discs could be arranged to directly generate a binary number that increases from 0 to 15 then back to 0 etc. as the disc rotates (0000, 0001, 0010, 0011, … 1111, 0000). However, a disc encoded with binary does not work well because as the disc turns and the number changes, multiple digits may change not quite simultaneously leading to unpredictable results. The disc should use the Gray code which changes by only one digit for each transition from one number to the next. The Gray code goes like this from zero to fifteen: 0000, 0001, 0011, 0010, 0110, 0111, 0101, 0100, 1100, 1101, 1111, 1110, 1010, 1011, 1001, 1000.
If the code is represented as a binary number, that is:
number = digit_3 * 8 + digit_2 * 4 + digit_1 * 2 + digit_0
then a nifty four lines of code involving bitwise XORs and bitwise shifts converts it into a true binary representation of a number. (I just can’t see how anyone could work out this code except by trial and error which probably says a lot about my thinking skills!)
In designing this device, I have a few things in mind.
1. My ability to produce precision engineering is limited by a lack of equipment (and possibly skill) so any design will have to take this into consideration. (Since I made this, I have acquired a small metal working lathe, a 3D printer and a laser cutter which would have made thing s easier if they had been available.)
2. The equipment will be out in all weathers. Since there will be rotating parts protruding from the device into that weather, the ingress of water and water vapour is (probably) inevitable.
I’ve decided to be a bit different and not use a disc which might acquire blobs of water either on the disc or on the sensors or light source. Instead, I am going to use reflective sensors acting on a cylinder with the zeros on the four tracks represented by what are essentially holes (which do not reflect – see the pictures). I am going to make the cylinder from four 60mm diam discs cut from 3mm aluminium sheet with three spacers, also from 3mm sheet. (With a laser cutter, I could have made these from white acrylic with very much less effort but then, buying an encoder from a shop would have been even easier – not quite sure why I’m stating the bleeding obvious here! I suppose I’m trying to say that “making” as a hobby is more about the journey etc. etc.)
Back to the mechanical aspect, the wind vane will probably need a damper. The simplest option is probably a disc running in an oil bath (although in the end, I chose to take the easy way out and simuate damping with software – with mixed results!)
With regard to the electronics, the sensors I am using are type QRD1114. The phototransistor responds to infrared light with an output current dependent on the intensity of the light. This means it can hover between “on” and “off” which can confuse a digital input (as mentioned above in connection with the radiometer). Again as already mentioned, a Schmitt Trigger circuit cures this as its output is either on or off (1 or 0) and nothing in between. In addition it has hysteresis. This means that the output switches off and on at different input voltages which eliminates any fluttering between on and off during a transition.
I usually use a 555 (actually 7555 low power version) connected as a Schmitt. This is how it works. The output switches on (digital 1) when the input drops below one third of the supply voltage and switches off (digital 0) when the input moves above two thirds of the supply.
To connect to the control microcontroller (an Adafruit Feather M0) by I2C, I will use my favourite port expander chip, the MCP23017.
The QRD1114 and the 7555s would probably work at 3.3volts supply but I feel more confident using 5volts. Also the LEDs on the sensors will draw about 50mA and my 3.3 supply is derived from the regulator on the microprocessor board whereas the 5 volts comes direct from the usb power suppy. To get down to 3.3 volts used by the Feather, I use the Sparkfun logic level shifter.
Wind speed – anemometer
This is a fairly simple device. In traditional manner, the wind catches (in this case four) cups on arms thus rotating a shaft with the speed of rotation of the shaft proportional to the wind speed. The shaft has a disk with slots in it which breaks the beam in a transmission opto-sensor (yes I know, I earlier made a case for not using this type of sensor in a device which will live outside!)